试题题干
Look at the graphs below. They show a comparison of the quarterly sales figures for 2000 and 2001 for five different companies A-E.
Which company does each sentence describe?
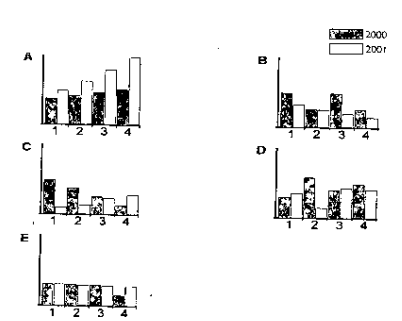
Sales fluctuated dramatically in 2000, whereas 2001 saw a steady decline in sales. 
Sales rose steadily throughout the two-year period, but the increase was more dramatic in 2001.
Although sales in 2000 reached a peak in the second quarter, this was the worst period for sales in 2001.
Sales remained steady for most of the two-year period despite a sudden fall at the end of 2000.
Sales started slowly in 2001, before recovering in the third quarter, in contrast to the previous year when sales declined steadily.
参考答案
正确答案:![]()