试题题干
Look at the charts below. Which chart does each sentence describe? For each sentence choose one letter(A-E).
The charts below show company sales. Which chart does each sentence describe?
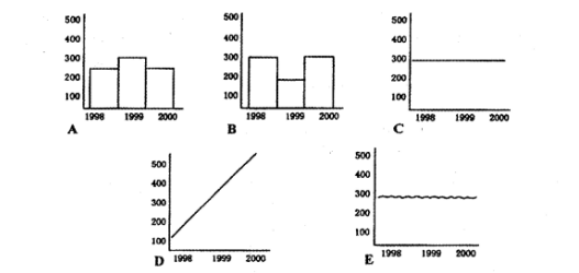
Sales didn't change from 1998 to 2000.

There was hardly any change in the sales throughout the period except for a slight rise on 1999.
Sales fell in 1999 and rose again to reach the 1998 sales.
Sales increased steadily from 1998 to 2000.
Sales fluctuated from 1998 to 2000.
参考答案
正确答案:![]()