试题题干
Write an essay based on the following chart. In your writing, you should:
1) interpret the chart, and
2) give your comments.
You should write about 150 words.
参考答案
试题解析
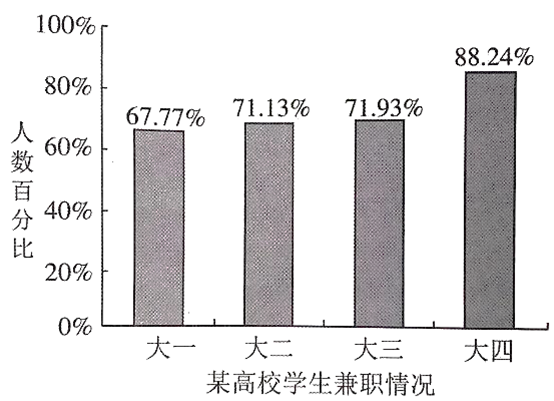
As is illustrated by the figure in the chart, the number of college students doing part-time jobs has been on rise steadily from 67.77% to 88.24% during the four-year university life. The percentage increases slightly from 67.77% to 71.93% for students holding part-time job from the first year to the third year, however, the proportion of seniors working part-time jump dramatically to 88.24%. From the change in the chart, it goes without saying that more and more college students choose to engage in outside programs recently.
Considering these changes, we can find several main reasons. Why the enthusiasm of freshman is lower than their elder classmates is due to the fact that intensive course planning and resourceful campus life occupy their plenty of spare time. From the perspective of graduate students, they have much more time for taking a part-time job when they have required assignment finished. But another important factor that cannot ignored is that as the graduation date is around the corner, students realize that they need to gain more working experience, which undoubtedly would improve their competitiveness and may facilitate them to obtain a better job.
From the changes in the charts, it is easy for us to predict that more and more college students will walk out their home and throw themselves into more various vacation activities.